
Distorted and Reckless Debt-and-Print Polices
As always, our Market Notes reports are available to you in PDF format. Click below to download.
First, an update:
Last year, we at Consilience Asset Management added a Macro-Economic component to our Relative Capital Flow Model*. Using market action, through a process of reverse engineering, we seek to identify which macro-economic climate is being represented in the market at any given time.
This is an important addition to our discipline as central banks across the globe are attempting to unwind decades of monetary expansion. As this unwinding occurs, it could have significant ramifications for the financial market. Thus, there is an increased need to monitor this process and the corresponding macro-economic result.
Below are the ratings of securities in the five scenarios that we are monitoring:
Inflation – Neutral,
Deflation – Neutral,
Stagflation – Negative,
Recovery – Neutral,
Financial Crisis – Neutral.

The above scenarios reflect the current Capital Flow* composite rating of the securities that have historically generated positive returns in the above economic environments.
In addition, our Global Macro Indicators* are as follows for the seven asset classes we invest in for our clients:
Global Equities – Neutral,
Global Bonds – Neutral,
Commodities – Neutral,
Gold – Neutral,
U.S. Dollar – Positive,
Real Estate – Negative,
Cryptocurrencies – Positive.
Now, to this month’s report: For some time, I have been warning about the consequences of a system based on unlimited money printing, debt creation and money debasement.
As a result, will a violent financial event occur? If so, will it take years, or it can happen tomorrow? Nobody knows.
In the meantime, investors have one duty to themselves and their dependents which is to protect their wealth from destruction.
How did we get to this point?
A major contributor can be traced back to 1971 when President Nixon closed the gold window. Since then, according to The Institute of International Finance, both global and US debt is up by over 80-times! In fact, in the first half of 2023 global debt rose by $10 trillion to a new record of $307 trillion.
This past March we had a dress rehearsal for the devastating financial impact such excessive debt can have. Led by Silicon Valley Bank and Credit Suisse, Switzerland’s second biggest bank, they went under in a matter of days due primarily to a quick and unprecedented rise in interest rates.
That rise in rates caused a severe decline in the asset values of the debt on their balance sheets, leaving them fundamentally insolvent.
It’s not just debt in the banking system that troubles me…
Globally, according to the Bank for International Settlements (BIS), governments and central banks have contributed not only to the creation of over $300 trillion in debt but over $2.2 quadrillion in the form of unfunded liabilities and derivatives. Yes, $2.2 quadrillion!
These derivatives are mostly unregulated bets among financial institutions and have been referred to as “financial weapons of mass destruction” by Warren Buffett.
Rising interest rates and bad debts are a timebomb, not just for the banking system, but for the entire global financial system. Today’s risks are just too big to ignore.
What’s driving this unlimited money printing, debt creation and money debasement?
Prior to 1971, there was a limit to the amount of new money and debt that could be created as gold acted as a constraint. Following 1971, the dollar was no longer priced in gold. So, the Fed no longer had gold as a constraint in increasing its supply, and as a result engaged in an absurd policy of money printing.
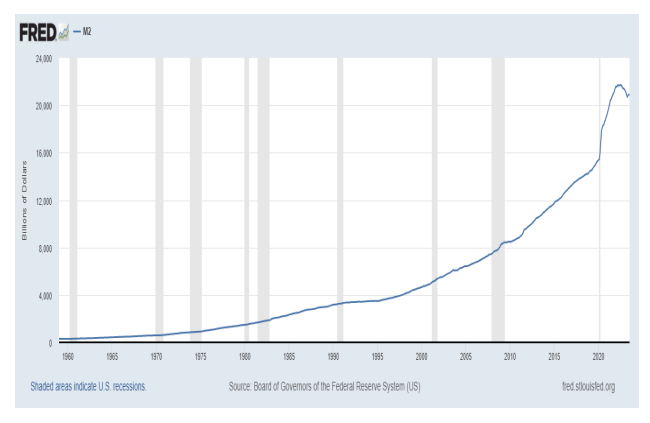
As shown in the next chart, as new money can’t be printed out of thin air and gold reserves were no longer necessary, each newly created dollar now needed only to be offset by new debt.
So, as the money supply expanded, so did our national debt.

And as with any asset, if you increase its supply, the value is diluted.
And this my friends is the true cause of inflation… a reduced purchasing power of the dollar.
The math plainly shows that expanding the broad money supply from $600 billion to $21 trillion since 1971is the real cause of inflation and the devaluation of the dollar’s purchasing power. (See M2 above)
As the inevitable inflation crisis emerges from precisely such absurd “policies,” the central bankers can no longer blame the obvious and long-dated/repressed inflationary consequences of their drunken monetary policies on a virus, supply chain constrains or even Vladimir Putin.
Nor can they continue to peddle the lie that inflation was merely “transitory,” a fact we made clear long before Fed Chairman Powell confessed it was not so.
Years of distorted, rigged and entirely reckless debt-and-print polices have made global economies and currencies weaker, not stronger and have made the entire financial system vulnerable to additional shocks, and crisis.
As pointed out in last month’s Consilience Market Notes, the expansion of Brazil, Russia, India, China, and South Africa (BRICS) has made it clear that the dedollarization of the international finance system is inevitable.
A larger BRICS will mean the world will increasingly use U.S. dollars less, thus potentially driving the dollar even lower, inflation higher and less demand for our Treasury bonds, resulting in even higher interest rates.
This does not appear to bode well for economic growth and likely result in headwinds for stock and bond prices. In light of this, what should an investor do?
My advice is to pay close attention to our capital flow indicators as summarized at the beginning of this report and described below, and as they change, so should the asset allocation of your portfolio.
In our seven asset classes listed, there are both inflation and deflation sensitive options. It is my belief that it would be prudent for investors to allocate a portion of their assets outside the traditional markets of stocks and bonds (paper assets) and into alternative asset classes (hard assets). Some of these are included in our seven assets listed on page 1 of this report.
It is important to note that alternative investments can result in increased portfolio volatility and as with traditional investments like stocks and bonds, are not guaranteed and can decline in value.
Conclusion: Recognizing that we are in uncharted waters with multiple moving parts, we must admit that there is no way to tell in advance exactly how this will unfold. But in such a transitionary environment, the ability to properly anticipate change is predicated upon a detached analysis of information from multiple sources, applying that information to imagine a plausible world different from today’s, understanding how new data points fit (or don’t fit) into that world and adjusting accordingly.
Although this will be no easy feat, our answer at Consilience Asset Management is to employ a discipline that we believe has the ability to circumvent the effects of these uncertainties and disparities between the above noted risks and actual market action. Ultimately, it will be the forces of supply and demand that will drive prices of financial assets higher or lower, regardless of the fundamental, geopolitical or economic circumstances.
The cornerstone of our process is our Global Macro Capital Flow Model. In this model, we monitor the movement of capital among the approximately $250 trillion of tradable global financial assets. Here, market trends can be identified regardless of their driver; debt, geopolitical, economic, or other…
Below is a picture of the distribution of the world’s liquid investment assets as a percent of the $250 trillion total…
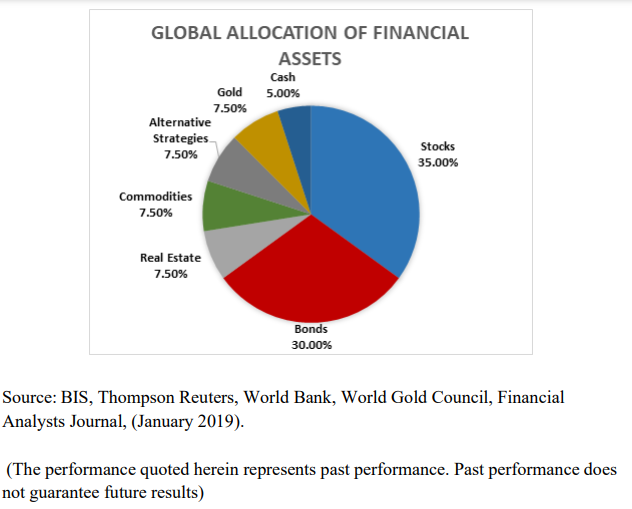
By measuring the capital flows of each of these categories relative to the total, both favorable and unfavorable investment trends are identified.
At Consilience Asset Management, we employ this process in deploying client assets.
A more complete description of our model and process can be found on our website: www.consilienceassetmanagement.com under the tab “Our Process.”
Based on this, the ratings for each of the eight asset classes that we monitor are included each month at the beginning of this report.
We are entering a new phase, as the decade-long bull markets for stocks appear to be winding down. We are cognizant of the new challenges inherent due to the structural changes noted in this report, as they will have a huge impact on the current supply/demand dynamics in the global marketplace.
As such, we realize that these are clearly challenging and unprecedented times and therefore it is important for the astute investor to be nimble and pay close attention!
Consilience Asset Management
Roger Faulring – Managing Partner/Sr. Portfolio Manager/Investment Strategist
Michelle Malone – President/Investment Advisor
Donna Stone – Managing Partner/Investment Advisor
Roger Faulring is an Investment Adviser Representative (IAR) with and offers Investment Advisory Services through B. Riley Wealth Advisors, Inc., (BRWA) a SEC Registered Investment Adviser (RIA). BRWA and Consilience Asset Management are not affiliated.
All opinions and estimates included in this communication constitute the author’s judgment as of the date of this report and are subject to change without notice. The information provided is not directed at any investor or category of investors and is provided solely as general information about products and services or to otherwise provide general investment education. None of the information provided should be regarded as a suggestion to engage in or refrain from any investment-related course of action as neither B. Riley Wealth Management nor its affiliates are undertaking to provide you with investment advice or recommendations of any kind. Securities and variable insurance products offered through B. Riley Wealth Management, Inc., Member FINRA/SIPC.
*Our Global Macro Tactical Strategy seeks to identify favorable investment opportunities among seven primary asset classes. Capital is rotated to the specific markets in an effort to control risk by underweighting or eliminating exposure to markets that exhibit elevated risk.
*Our Relative Capital Flow Model is the cornerstone of our tactical allocation decisions and is augmented by our Behavior, Economic, Monetary and Stability indicators.
IMPORTANT NOTICES: The information contained in this electronic message (including any attachments) is privileged and confidential information intended only for the use of the recipient(s). Please notify the sender by email if you are not the intended recipient. If you are not the intended recipient, you are hereby notified that any dissemination, distribution or copying of this communication is strictly prohibited. B. Riley Capital Management, Inc. ("BRCM") does not accept time sensitive, actionoriented messages or transaction orders, including orders to purchase or sell securities, via email or by any other electronic means. BRCM reserves the right to monitor and review the content of all messages sent to or from this email address. Messages sent to or from this email address are stored by a third-party vendor and may be provided to regulators upon request. Neither the sender nor BRCM accepts any liability for any errors or omissions arising as a result of transmission. Any information contained in this electronic message is not an offer or solicitation to buy or sell any security, and while such information has been obtained from sources believed to be reliable, its accuracy is not guaranteed. Any references to the terms of executed transactions should be treated as preliminary only and subject to BRCM's formal written confirmation. This message is for information purposes only and is not an investment recommendation or a solicitation. Past performance is not indicative of future returns. All information is subject to change without notice. Unless indicated, these views are the author's and may differ from those of the firm or others in the firm. BRCM does not represent this is accurate or complete and may not update this information.