
Is the World Abandoning the Dollar?
As always, our Market Notes reports are available to you in PDF format. Click below to download.
First, an update:
Last year, we at Consilience Asset Management added a Macro-Economic component to our Relative Capital Flow Model*. Using market action, through a process of reverse engineering, we seek to identify which macro-economic climate is being represented in the market at any given time.
This is an important addition to our discipline as central banks across the globe are attempting to unwind decades of monetary expansion. As this unwinding occurs, it could have significant ramifications for the financial market. Thus, there is an increased need to monitor this process and the corresponding macro-economic result.
Below are the ratings of securities in the five scenarios that we are monitoring:
Inflation – Positive,
Deflation – Negative,
Stagflation – Neutral,
Recovery – Positive,
Financial Crisis – Negative.

The above scenarios reflect the current Capital Flow* composite rating of the securities that have historically generated positive returns in the above economic environments.
In addition, our Global Macro Indicators* are as follows for the seven asset classes we invest in for our clients:
Global Equities – Positive,
Global Bonds – Neutral,
Commodities – Neutral,
Gold – Neutral,
U.S. Dollar – Neutral,
Real Estate – Neutral,
Cryptocurrencies – Neutral.
Now, to this month’s report:
Since the 1970s it’s been virtually impossible for a country to function without access to US dollars.
According to the Bank for International Settlements (BIS), since 2001 Brazil, Russia, India, China, and South Africa (the BRICS) have been toying with the idea of forming a political/monetary counterweight to U.S. dominance. But beyond some aggressive gold buying by Russia and China, there was more talk than action.
However, in just the past year, the BIS reports that Argentina, Indonesia, Saudi Arabia, Iran, Mexico, Turkey, the United Arab Emirates (UAE), and Egypt have either applied to join or expressed an interest in joining this political/monetary counterweight.
Why the increased action away from the US dollar?
For starters, the US Federal Reserve is dealing with inflation in a contracting economy… not a good combination.
Remember, when the Fed engages in QE/Money printing, the increased supply of dollars devalues its worth. This is the classic definition of inflation.
In the 2020-2022 period, according to the Federal Reserve, an additional $10tn of new dollars ($5.2tn in fiscal stimulus and $4.8tn in Fed QE stimulus) were created.
In the following chart, note the dramatic increase in the Federal Reserve’s Balance Sheet.
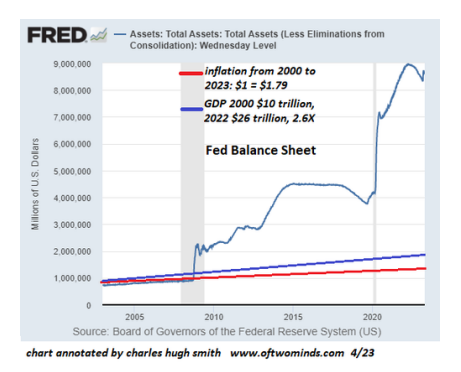
Here, you can see the sum of dollars created out of thin air as the means to inject new dollars into the financial system. Although this is not a new phenomenon, as shown in the above chart, the trend has accelerated in recent years.
If the Fed balance sheet had tracked GDP, it would have risen from around $700 billion in the early 2000s to a meager $1.8 trillion, a far cry from its current level of $8.6 trillion.
It is this trend that is causing the U.S. to deal with issues they never had to deal with before: less demand for dollars and more competition.
As expected, this means the US must offer higher interest on newly issued Treasury debt to attract foreign buyers.
Thus, there is clear evidence of a fundamental change in the long-term interest rate trend in the yield on the “bellwether” 10-Year US Treasury note, which has violated its long-term downtrend as shown in the chart below.

Is this due to reduced interest in foreigners buying US Treasuries as discussed above? Yes, in addition to the Fed’s efforts to raise interest rates to slow US economic growth and the rising rate of inflation.
Remember, when the US prints new dollars, they offset these dollars with new debt.
As the next chart below shows, the increased rate of borrowing has vastly exceeded the increase in the US economic growth. If federal debt had tracked GDP since 1990, it would be around $16 trillion, half of its current $32 trillion.
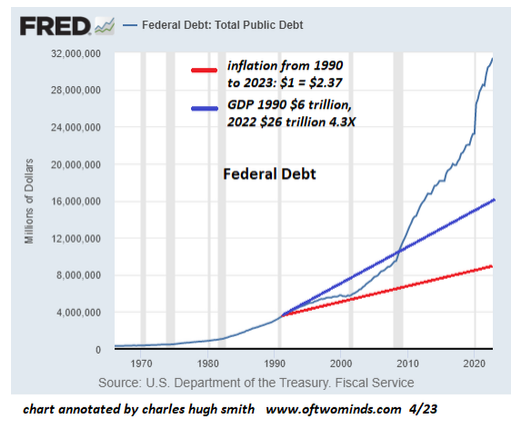
In 2010, respected economists (Carmen Reinhart and Kenneth Rogoff) concluded that at a government debt to GDP rate of over 90% it becomes exceedingly difficult for a nation to grow its way out of its debt burden.
According to the Bank for International Settlements (BIS), core government debt in the United States, is now 112.6%.
Now that after decades of declining interest rates the long-term trend is once again rising, Reinhart and Rogoff’s theories are about to be tested.
But their theory dealt exclusively with government debt. What about total debt; government, corporate and consumer?
According to the International Institute for Finance, global debt reached almost $300 trillion by the second quarter of 2021. In relation to GDP, this was some 350%, above the 280% before September 2008 Lehman bankruptcy.
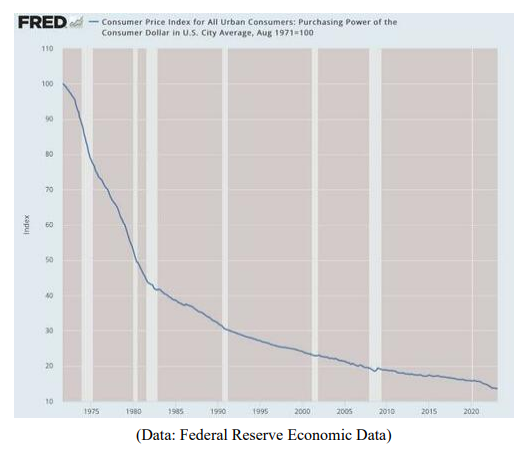
The cost of this debt induced increase in the US money supply has been an accelerating currency debasement. This has certainly contributed to the reduction of foreign buyers of US Treasury debt.
Here's a sobering picture of the debasement of the US dollar’s purchasing power since we went off the gold standard and gave the Fed the ability to print money without the constraints of matching the new dollars with a portion of gold.
The 1971 dollar is now worth about 13 cents!
So, as pointed out in last month’s Consilience Market Notes, either central banks raise rates to allegedly “kill inflation” thus risking an economic and markets crisis, or they resort to more money printing and continue to debase the dollar.
The Fed has recently been on the “kill inflation” path. As they’ve raised interest rates and reduced their balance sheet (the collateral used by banks to make loans), loan demand has declined. As a result, bankers in the March survey reported worsening business activity.
It goes without saying that a loan moratorium is a big problem for the US economy where 70% of growth comes from mostly credit-funded spending. But it's an even bigger problem for those small banks that had gotten hit especially hard during the recent bank crisis.
According to the Fed’s latest Banking Conditions Survey, these smaller banks, defined as banks with less than $250bn in assets are responsible for roughly 50% of US commercial and industrial lending, 60% of residential real estate lending, 80% of commercial real estate lending, and 45% of consumer lending.
So, because of reduced lending by these banks, key segments of the economy will potentially be locked out of critical lines of funding. If this occurs, the US risks spiraling into a deep recession.
Thus, as we’ve pointed out in previous reports… the US Federal Reserve is stuck between a “rock and a hard place.” Fight inflation and destroy the economy or print money to revive the economy and destroy the dollar.
Considering the dilemma facing the Federal Reserve and the potential impact their actions will have on the financial markets, what should an investor do?
At Consilience Asset Management we regularly run stress tests which analyze multiple economic, geopolitical, and financial scenarios. One of these is a” “Fed Stress Test.” In our current simulation we simulate the impact of heightened stress in commercial real estate and debt/bond markets and the impact it will potentially have on the financial markets and portfolio adjustments that can be made in an effort to protect assets during such an outcome.
We have been presenting this analysis in recent client reviews. To receive a copy or to schedule your next formal portfolio review, please call or email our Administrative Manager, Sue Simpson at 716-768-1108 or ssimpson@consil.co.
My advice continues to be: Pay close attention to our capital flow indicators as summarized at the beginning of this report and described below, and as they change, so should the asset allocation of your portfolio.
In our seven asset classes listed, there are both inflation and deflation sensitive options. It is my belief that it would be prudent for investors to allocate a portion of their assets outside the traditional markets of stocks and bonds and into alternative asset classes. Some of these are included in our seven assets listed on page 1 of this report.
It is important to note that alternative investments can result in increased portfolio volatility and as with traditional investments like stocks and bonds, are not guaranteed and can decline in value.
Conclusion: Recognizing that we are in uncharted waters with multiple moving parts, we must admit that there is no way to tell in advance exactly how this will unfold. But in such a transitionary environment, the ability to properly anticipate change is predicated upon a detached analysis of information from multiple sources, applying that information to imagine a plausible world different from today’s, understanding how new data points fit (or don’t fit) into that world and adjusting accordingly.
Although this will be no easy feat, our answer at Consilience Asset Management is to employ a discipline that we believe has the ability to circumvent the effects of these uncertainties and disparities between the above noted risks and actual market action. Ultimately, it will be the forces of supply and demand that will drive prices of financial assets higher or lower, regardless of the fundamental, geopolitical, or economic circumstances.
The cornerstone of our process is our Global Macro Capital Flow Model.
In this model, we monitor the movement of capital among the approximately $250 trillion of tradable global financial assets. Here, market trends can be identified regardless of their driver; debt, geopolitical, economic, or other…
Below is a picture of the distribution of the world’s liquid investment assets as a percent of the $250 trillion total…
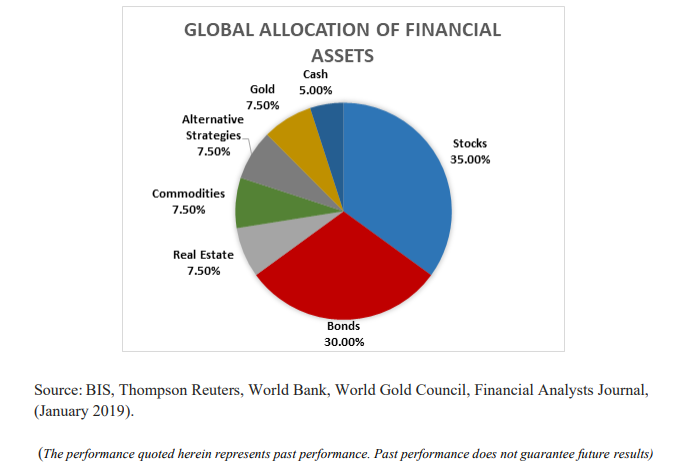
By measuring the capital flows of each of these categories relative to the total, both favorable and unfavorable investment trends are identified.
At Consilience Asset Management, we employ this process in deploying client assets.
A more complete description of our model and process can be found on our website: www.consilienceassetmanagement.com under the tab “Our Process.”
Based on this, the ratings for each of the eight asset classes that we monitor are included each month at the beginning of this report.
We are entering a new phase, as the decade-long bull markets for stocks appear to be winding down. We are cognizant of the new challenges inherent due to the structural changes noted in this report, as they will have a huge impact on the current supply/demand dynamics in the global marketplace.
As such, we realize that these are clearly challenging and unprecedented times and therefore it is important for the astute investor to be nimble and pay close attention!
Consilience Asset Management
Roger Faulring – Managing Partner/Portfolio Manager/Market Strategist
Michelle Malone – President/Managing Partner
Donna Stone – Partner/Investment Advisor
Roger Faulring is an Investment Adviser Representative (IAR) with and offers Investment Advisory Services through B. Riley Wealth Advisors, Inc., (BRWA) a SEC Registered Investment Adviser (RIA). BRWA and Consilience Asset Management are not affiliated.
All opinions and estimates included in this communication constitute the author’s judgment as of the date of this report and are subject to change without notice. The information provided is not directed at any investor or category of investors and is provided solely as general information about products and services or to otherwise provide general investment education. None of the information provided should be regarded as a suggestion to engage in or refrain from any investment-related course of action as neither B. Riley Wealth Management nor its affiliates are undertaking to provide you with investment advice or recommendations of any kind. Securities and variable insurance products offered through B. Riley Wealth Management, Inc., Member FINRA/SIPC.
*Our Global Macro Tactical Strategy seeks to identify favorable investment opportunities among seven primary asset classes. Capital is rotated to the specific markets in an effort to control risk by underweighting or eliminating exposure to markets that exhibit elevated risk.
*Our Relative Capital Flow Model is the cornerstone of our tactical allocation decisions and is augmented by our Behavior, Economic, Monetary and Stability indicators.
IMPORTANT NOTICES: The information contained in this electronic message (including any attachments) is privileged and confidential information intended only for the use of the recipient(s). Please notify the sender by email if you are not the intended recipient. If you are not the intended recipient, you are hereby notified that any dissemination, distribution or copying of this communication is strictly prohibited. B. Riley Capital Management, Inc. ("BRCM") does not accept time sensitive, action-oriented messages or transaction orders, including orders to purchase or sell securities, via email or by any other electronic means. BRCM reserves the right to monitor and review the content of all messages sent to or from this email address. Messages sent to or from this email address are stored by a third-party vendor and may be provided to regulators upon request. Neither the sender nor BRCM accepts any liability for any errors or omissions arising as a result of transmission. Any information contained in this electronic message is not an offer or solicitation to buy or sell any security, and while such information has been obtained from sources believed to be reliable, its accuracy is not guaranteed. Any references to the terms of executed transactions should be treated as preliminary only and subject to BRCM's formal written confirmation. This message is for information purposes only and is not an investment recommendation or a solicitation. Past performance is not indicative of future returns. All information is subject to change without notice. Unless indicated, these views are the author's and may differ from those of the firm or others in the firm. BRCM does not represent this is accurate or complete and may not update this information.