
Has the Fed Successfully Engineered a New Bull Market in Stocks?
As always, our Market Notes reports are available to you in PDF format. Click below to download.
First, an update:
Last year, we at Consilience Asset Management added a Macro-Economic component to our Relative Capital Flow Model*. Using market action, through a process of reverse engineering, we seek to identify which macro-economic climate is being represented in the market at any given time.
This is an important addition to our discipline as central banks across the globe are attempting to unwind decades of monetary expansion. As this unwinding occurs, it could have significant ramifications for the financial market. Thus, there is an increased need to monitor this process and the corresponding macro-economic result.
Below are the ratings of securities in the five scenarios that we are monitoring:
Inflation – Negative,
Deflation – Negative,
Stagflation – Negative,
Recovery – Neutral,
Financial Crisis – Negative.
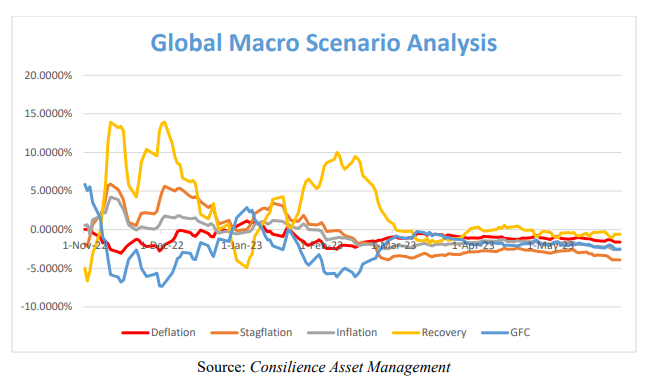
The above scenarios reflect the current Capital Flow* composite rating of the securities that have historically generated positive returns in the above economic environments.
In addition, our Global Macro Indicators* are as follows for the seven asset classes we invest in for our clients:
Global Equities – Neutral,
Global Bonds – Neutral,
Commodities – Negative,
Gold – Neutral,
U.S. Dollar – Neutral,
Real Estate – Neutral,
Cryptocurrencies – Neutral.
Now, to this month’s report:
What do we make of the capital flow indicators above? Keep in mind, these are not forecasts, rather a snapshot of capital flow trends among global investors. Thus, it appears that investors actions suggest uncertainty, both in terms of asset class flows as well as economic outlook albeit a slight bias toward a recovery moving forward.
But are investors correctly anticipating the future economy… and who are these investors?
Since January, retail investors returned, having poured $1.5 billion daily into U.S. stocks, the highest ever recorded. (This, according to the latest report from retail order flow specialist Vanda Research).
This appears to be built on the premise of a Federal Reserve “pivot” and a “no recession” scenario. In this scenario, economic growth continues as inflation falls and the Federal Reserve returns to a rate-cutting cycle. And as shown above, this is what our Capital Flow indicators appear to be saying.
If this is correct, it supports their enthusiasm as such a rate-cutting scenario has been a driving force for higher stock prices in recent history.
Since 2009, there has been more than $43 trillion in various liquidity supports. To put that into perspective, the inputs exceed underlying economic growth by more than 10-fold. (Source: Federal Reserve Bank of St. Louis)
Keep in mind, “liquidity supports” means debt!
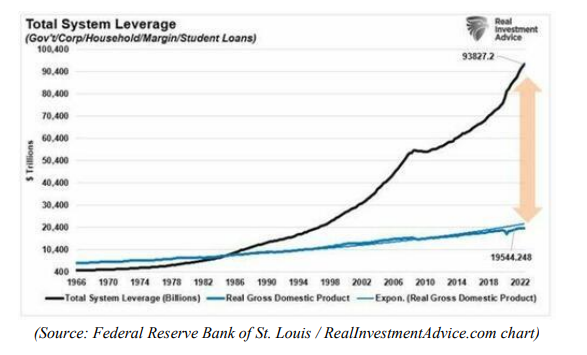
And as shown above, although that $43 trillion has supported a multi-decade bull market in stocks, it hasn’t translated into a corresponding boon for the economy. But that hasn’t mattered to the stock market. Stocks rose regardless of the lackluster economy as newly printed money created greater demand for stocks.
But can this grind on for another multi-decade period? Or is a change coming?
Following the decline to approximately 2% growth in money creation following the 2008 Global Financial Crisis, the Fed has engineered a constant growth rate of between 4 and 10% with an unprecedented spike during the Covid Crisis in 2020.
Note that going as far back as 1960, M2 growth has never fallen into negative territory before… until now.

Is this just a statistical anomaly following the extreme surge in 2020 or is something different going on here?
Let’s go back to the comparison between the growth in money and debt and the effect on the economy since quantitative easing began in 2008. In doing so, we see that there has been no “real” growth in the economy since 2008.
In fact, economic growth has been in protracted decline relative to the money supply for decades, a phenomenon that has only worsened during the QE era.
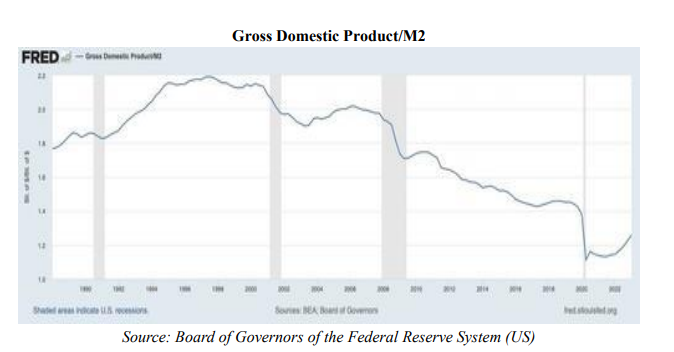
Note the similar trajectory in the chart of the velocity of money.
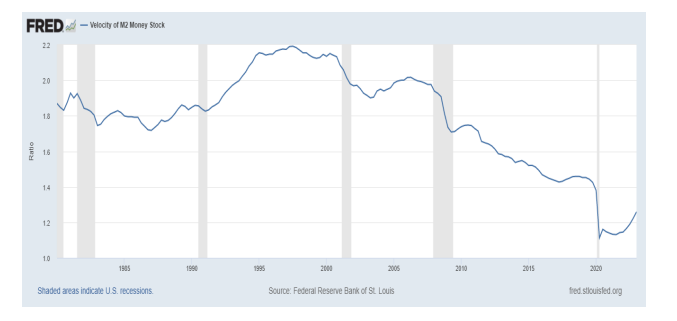
The velocity of money is the frequency at which one unit of currency is used to purchase domestically produced goods and services within a given time period.
In other words, it is the number of times one dollar is spent to buy goods and services per unit of time. If the velocity of money is increasing, then more transactions are occurring between individuals in an economy.
There should be no surprise that there is a tight correlation between the 2 charts as consumer spending represents about two-thirds of the US economy.
But are things changing? Is it possible that individual investors are missing these changes and expecting the Fed to revert to a monetary expansion phase by increasing our national debt even further?
This, even as massive amounts of bad debt have been exposed as a result of rising interest rates over the past 14 months. These rate increases have exposed the vulnerability in commercial real estate, overleverage banks, overextended corporations and an eroding capital base underlying many of our nation’s pension funds. This, at a time when the stock market is still well overvalued relative to its historical mean.
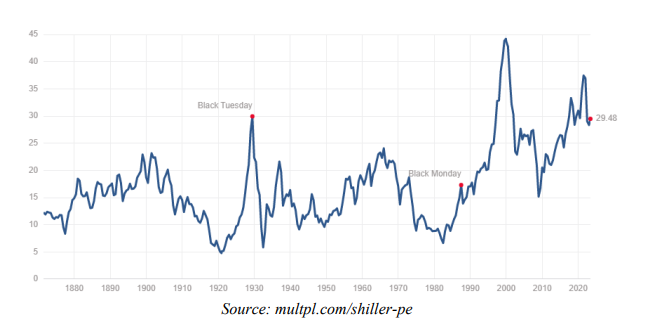
According to Hidden Levers and the Atlanta Fed data, the long-tern historical average for the Shiller Cyclically Adjusted PE, is 17 vs the current 29.48 shown above.
But what if individual investors are right and we are close to the end of the Fed’s rate hiking cycle? Does that not mean we’re out of the woods and the markets will propel to new highs? Or, rather, could it mean we’re just entering the woods?
For the first time since 1981, the US Treasury yield curve has been inverted for over 6 months. “Inverted” means short-term yields are higher than long-term yields.
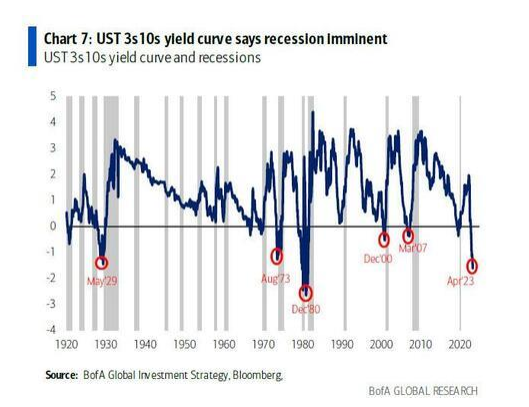
According to BofA Global Research, on average, a US recession has started 6 months after inversion of 3-month and10-year Treasury yields.
Many point to a recession as the successful culmination of the Fed’s tightening policy that has brought about this slowing economy. Yes, successful because it appears to have brought inflation under control which theoretically will be good for stocks and the economy.
This was certainly true following the recessions of the early 1980’s. But note the difference in stock valuation levels then vs. now. (See Shiller PE’s on p. 6).
Considering these conflicting forces and market signals, what should an investor do?
My advice continues to be: Pay close attention to our capital flow indicators as summarized at the beginning of this report and described below, and as they change, so should the asset allocation of your portfolio.
In our seven asset classes listed, there are both inflation and deflation sensitive options. It is my belief that it would be prudent for investors to allocate a portion of their assets outside the traditional markets of stocks and bonds and into alternative asset classes. Some of these are included in our seven assets listed on page 1 of this report.
It is important to note that alternative investments can result in increased portfolio volatility and as with traditional investments like stocks and bonds, are not guaranteed and can decline in value.
Conclusion: Recognizing that we are in uncharted waters with multiple moving parts, we must admit that there is no way to tell in advance exactly how this will unfold. But in such a transitionary environment, the ability to properly anticipate change is predicated upon a detached analysis of information from multiple sources, applying that information to imagine a plausible world different from today’s, understanding how new data points fit (or don’t fit) into that world and adjusting accordingly.
Although this will be no easy feat, our answer at Consilience Asset Management is to employ a discipline that we believe has the ability to circumvent the effects of these uncertainties and disparities between the above noted risks and actual market action. Ultimately, it will be the forces of supply and demand that will drive prices of financial assets higher or lower, regardless of the fundamental, geopolitical, or economic circumstances.
The cornerstone of our process is our Global Macro Capital Flow Model.
In this model, we monitor the movement of capital among the approximately $250 trillion of tradable global financial assets. Here, market trends can be identified regardless of their driver; debt, geopolitical, economic, or other…
Below is a picture of the distribution of the world’s liquid investment assets as a percent of the $250 trillion total…

By measuring the capital flows of each of these categories relative to the total, both favorable and unfavorable investment trends are identified.
At Consilience Asset Management, we employ this process in deploying client assets.
A more complete description of our model and process can be found on our website: www.consilienceassetmanagement.com under the tab “Our Process.”
Based on this, the ratings for each of the eight asset classes that we monitor are included each month at the beginning of this report.
We are entering a new phase, as the decade-long bull markets for stocks appear to be winding down. We are cognizant of the new challenges inherent due to the structural changes noted in this report, as they will have a huge impact on the current supply/demand dynamics in the global marketplace.
As such, we realize that these are clearly challenging and unprecedented times and therefore it is important for the astute investor to be nimble and pay close attention!
Consilience Asset Management
Roger Faulring – Managing Partner/Sr. Portfolio Manager/Investment Strategist
Michelle Malone – President/Investment Advisor
Donna Stone – Managing Partner/Investment Advisor
Roger Faulring is an Investment Adviser Representative (IAR) with and offers Investment Advisory Services through B. Riley Wealth Advisors, Inc., (BRWA) a SEC Registered Investment Adviser (RIA). BRWA and Consilience Asset Management are not affiliated.
All opinions and estimates included in this communication constitute the author’s judgment as of the date of this report and are subject to change without notice. The information provided is not directed at any investor or category of investors and is provided solely as general information about products and services or to otherwise provide general investment education. None of the information provided should be regarded as a suggestion to engage in or refrain from any investment-related course of action as neither B. Riley Wealth Management nor its affiliates are undertaking to provide you with investment advice or recommendations of any kind. Securities and variable insurance products offered through B. Riley Wealth Management, Inc., Member FINRA/SIPC.
*Our Global Macro Tactical Strategy seeks to identify favorable investment opportunities among seven primary asset classes. Capital is rotated to the specific markets in an effort to control risk by underweighting or eliminating exposure to markets that exhibit elevated risk.
*Our Relative Capital Flow Model is the cornerstone of our tactical allocation decisions and is augmented by our Behavior, Economic, Monetary and Stability indicators.
IMPORTANT NOTICES: The information contained in this electronic message (including any attachments) is privileged and confidential information intended only for the use of the recipient(s). Please notify the sender by email if you are not the intended recipient. If you are not the intended recipient, you are hereby notified that any dissemination, distribution or copying of this communication is strictly prohibited. B. Riley Capital Management, Inc. ("BRCM") does not accept time sensitive, action-oriented messages or transaction orders, including orders to purchase or sell securities, via email or by any other electronic means. BRCM reserves the right to monitor and review the content of all messages sent to or from this email address. Messages sent to or from this email address are stored by a third-party vendor and may be provided to regulators upon request. Neither the sender nor BRCM accepts any liability for any errors or omissions arising as a result of transmission. Any information contained in this electronic message is not an offer or solicitation to buy or sell any security, and while such information has been obtained from sources believed to be reliable, its accuracy is not guaranteed. Any references to the terms of executed transactions should be treated as preliminary only and subject to BRCM's formal written confirmation. This message is for information purposes only and is not an investment recommendation or a solicitation. Past performance is not indicative of future returns. All information is subject to change without notice. Unless indicated, these views are the author's and may differ from those of the firm or others in the firm. BRCM does not represent this is accurate or complete and may not update this information.