
Recovery?
As always, our Market Notes reports are available to you in PDF format. Click below to download.
Last year, we at Consilience Asset Management added a Macro-Economic component to our Relative Capital Flow Model*. Using market action, through a process of reverse engineering, we seek to identify which macro-economic climate is being represented in the market at any given time.
This is an important addition to our discipline as central banks across the globe are attempting to unwind decades of monetary expansion. As this unwinding occurs, it could have significant ramifications for the financial market. Thus, there is an increased need to monitor this process and the corresponding macro-economic result.
Here are the four scenarios that we are closely monitoring along with their respective ratings:
Inflation – Negative,
Deflation – Negative,
Stagflation – Negative,
Recovery – Positive.

The above scenarios, reflect the current Capital Flow* composite rating of the securities that have historically generated positive returns in the above economic environments.
In addition, our Global Macro Indicators* are as follows for the 7 asset classes we invest in for our clients:
Global Equities – Positive,
Global Bonds – Neutral,
Commodities – Neutral,
Gold – Positive,
U.S. Dollar – Neutral,
Real Estate – Neutral,
Cryptocurrencies – Positive.
Now, to this month’s report:
As shown above, our Capital Flow Indicators have moved favorably during the past week, most notably with a positive rating for our recovery model. How is this possible?
Has the Federal Reserve engineered a soft landing for the economy while curbing inflation? Has the current administration introduced a durable plan to address our ever-expanding debt without crashing the economy and the markets?
If not, then what is driving the financial markets higher in recent weeks?
There’s an old expression coined by political strategist, James Carville, “It’s the economy, stupid.” That may have been an astute political observation when he made the statement in 1992, but today, price moves in the financial markets bear no resemblance to the economy. No today, as our statistical work suggests, “it is absolutely not the economy.”
For example, while the stock market has returned more than 180 percent since the 2007 peak, that increase in asset prices was more than 6x the growth in real GDP and 2.3x the growth in corporate revenue.
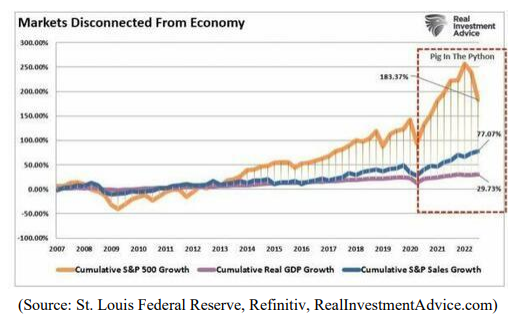
As pointed out on numerous occasions in our Consilience Market Notes, rather than the economy, it’s been Central Bank money printing or Quantitative Easing (QE), and zero precent interest rates that have been the primary driver for rising stock and bond prices.
As shown below, while the Federal Reserve was engaged in money printing/expanding their balance sheet, the stock market rose. When they reversed course last year, stocks declined.

So, is the printing about to resume? Is that what has been propelling the stock market higher?
Not necessarily. But the perception that inflation has peaked and that the Fed can relent in their efforts to raise rates further and discontinue shrinking their balance sheet appears to be the catalyst for the current rise in stocks.
Yes, it appears that the Bullish case rests on the assumption that the Fed can flip a switch and the decade-long Bull market will resume.
If this is the case, then a new leg of the bull market may continue to move higher devoid of any reasonable economic foundation.
Note the inverse relationship between periods where the Fed raises interest rates and reduces interest rates. A move in the Fed Funds Rate is a by-product of Federal Reserve monetary policy. Rates decline when they are printing/expanding their balance sheet and rates rise when they reverse course.
And as shown below, the stock market reacts to these moves.

Looking at the trajectory of the 2022 Bear market, we see two counter-trend rallies. One in March and one that ran through the summer (July/August).

As shown below, during those 2 previous counter-trend rallies, the S&P 500’s rallies did not occur following a full 3 Standard Deviation move (green line) below its mean (zero line). The current move has followed a 3 standard deviation decline and last week the rally has taken the market back to the mean (zero line).
If this trend persists, the market could possibly once again exceed to zero line (mean) and move back into positive territory for the first time since last March.
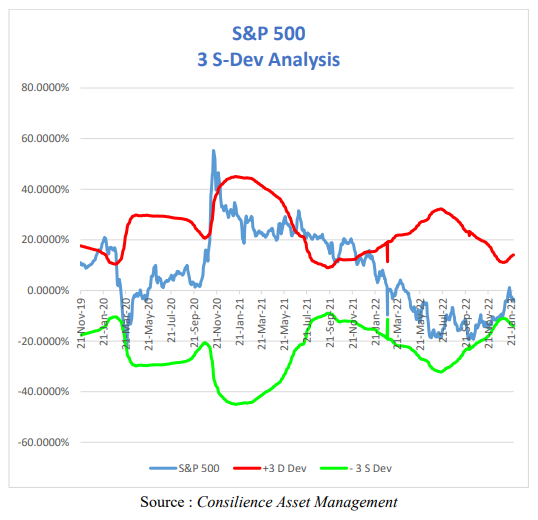
Thus, there is reason to believe that the current trend has a statistical likelihood of continuing higher. This is reflected in the positive ratings in our Recovery Model and Equity Model, shown at the beginning of this report.
How far and how long will this trend persist is unknown. The long-term challenges of historically high debt levels, record stock valuation levels, and geo-political uncertainties are still present and have not been addressed in any meaningful way.
In light of this uncertainty, what should an investor do?
My advice is to pay close attention to our capital flow indicators as summarized at the beginning of this report and described below, and as they change, so should the asset allocation of your portfolio.
In our seven asset classes listed, there are both inflation and deflation sensitive options. It is my belief that it would be prudent for investors to allocate a portion of their assets outside the traditional markets of stocks and bonds and into alternative asset classes. Some of these are included in our seven assets listed on page 1 of this report.
It is important to note that alternative investments can result in increased portfolio volatility and as with traditional investments like stocks and bonds, are not guaranteed and can decline in value.
Conclusion: Recognizing that we are in uncharted waters with multiple moving parts, we must admit that there is no way to tell in advance exactly how this will unfold. But in such a transitionary environment, the ability to properly anticipate change is predicated upon a detached analysis of information from multiple sources, applying that information to imagine a plausible world different from today’s, understanding how new data points fit (or don’t fit) into that world and adjusting accordingly.
Although this will be no easy feat, our answer at Consilience Asset Management is to employ a discipline that we believe has the ability to circumvent the effects of these uncertainties and disparities between the above noted risks and actual market action. Ultimately, it will be the forces of supply and demand that will drive prices of financial assets higher or lower, regardless of the fundamental, geopolitical, or economic circumstances.
The cornerstone of our process is our Global Macro Capital Flow Model.
In this model, we monitor the movement of capital among the approximately $250 trillion of tradable global financial assets. Here, market trends can be identified regardless of their driver; debt, geopolitical, economic, or other…
Below is a picture of the distribution of the world’s liquid investment assets as a percent of the $250 trillion total…

(The performance quoted herein represents past performance. Past performance does not guarantee future results)
By measuring the capital flows of each of these categories relative to the total, both favorable and unfavorable investment trends are identified.
At Consilience Asset Management, we employ this process in deploying client assets.
A more complete description of our model and process can be found on our website:
www.consilienceassetmanagement.com under the tab “Our Process.”
Based on this, the ratings for each of the eight asset classes that we monitor are included each month at the beginning of this report.
We are entering a new phase, as the decade-long bull markets for stocks appear to be winding down. We are cognizant of the new challenges inherent due to the structural changes noted in this report, as they will have a huge impact on the current supply/demand dynamics in the global marketplace.
As such, we realize that these are clearly challenging and unprecedented times and therefore it is important for the astute investor to be nimble and pay close attention!
Consilience Asset Management
Roger Faulring – Managing Partner/Portfolio Manager/Market Strategist
Michelle Malone – President/Managing Partner
Donna Stone – Partner/Investment Advisor
Roger Faulring is an Investment Adviser Representative (IAR) with and offers Investment Advisory Services through B. Riley Wealth Advisors, Inc., (BRWA) a SEC Registered Investment Adviser (RIA). BRWA and Consilience Asset Management are not affiliated.
All opinions and estimates included in this communication constitute the author’s judgment as of the date of this report and are subject to change without notice. The information provided is not directed at any investor or category of investors and is provided solely as general information about products and services or to otherwise provide general investment education. None of the information provided should be regarded as a suggestion to engage in or refrain from any investment-related course of action as neither B. Riley Wealth Management nor its affiliates are undertaking to provide you with investment advice or recommendations of any kind. Securities and variable insurance products offered through B. Riley Wealth Management, Inc., Member FINRA/SIPC.
*Our Global Macro Tactical Strategy seeks to identify favorable investment opportunities among seven primary asset classes. Capital is rotated to the specific markets in an effort to control risk by underweighting or eliminating exposure to markets that exhibit elevated risk.
*Our Relative Capital Flow Model is the cornerstone of our tactical allocation decisions and is augmented by our Behavior, Economic, Monetary and Stability indicators.
IMPORTANT NOTICES: The information contained in this electronic message (including any attachments) is privileged and confidential information intended only for the use of the recipient(s). Please notify the sender by email if you are not the intended recipient. If you are not the intended recipient, you are hereby notified that any dissemination, distribution or copying of this communication is strictly prohibited. B. Riley Capital Management, Inc. ("BRCM") does not accept time sensitive, action-oriented messages or transaction orders, including orders to purchase or sell securities, via email or by any other electronic means. BRCM reserves the right to monitor and review the content of all messages sent to or from this email address. Messages sent to or from this email address are stored by a third-party vendor and may be provided to regulators upon request. Neither the sender nor BRCM accepts any liability for any errors or omissions arising as a result of transmission. Any information contained in this electronic message is not an offer or solicitation to buy or sell any security, and while such information has been obtained from sources believed to be reliable, its accuracy is not guaranteed. Any references to the terms of executed transactions should be treated as preliminary only and subject to BRCM's formal written confirmation. This message is for information purposes only and is not an investment recommendation or a solicitation. Past performance is not indicative of future returns. All information is subject to change without notice. Unless indicated, these views are the author's and may differ from those of the firm or others in the firm. BRCM does not represent this is accurate or complete and may not update this information.