
The Fed, Inflation, and the Russia/Ukraine War in 2023 – A Bad Combination
As always, our Market Notes reports are available to you in PDF format. Click below to download.
As pointed out in last month’s report, we at Consilience Asset Management have added a MacroEconomic component to our Relative Capital Flow Model*. Using market action, through a process of reverse engineering, we seek to identify which macro-economic climate is being represented in the market at any given time. This is an important addition to our discipline as central banks across the globe are attempting to unwind decades of monetary expansion. As this unwinding occurs, it will have significant ramifications for the financial market. Thus, there is an increased need to monitor this process and the corresponding macro-economic result. Here are the four scenarios that we are closely monitoring along with their respective ratings:
Inflation – Negative,
Deflation – Neutral,
Stagflation – Negative,
Recovery – Neutral.
The above scenarios, reflect the current Capital Flow* composite rating of the securities that have historically generated positive returns in the above economic environments. Our Global Macro Indicators* are as follows for the 7 asset classes we invest in for our clients:
Global Equities – Negative,
Global Bonds – Negative,
Commodities – Neutral,
Gold – Positive,
U.S. Dollar – Neutral,
Real Estate – Neutral,
Cryptocurrencies – Neutral.
Now, to this month’s report:
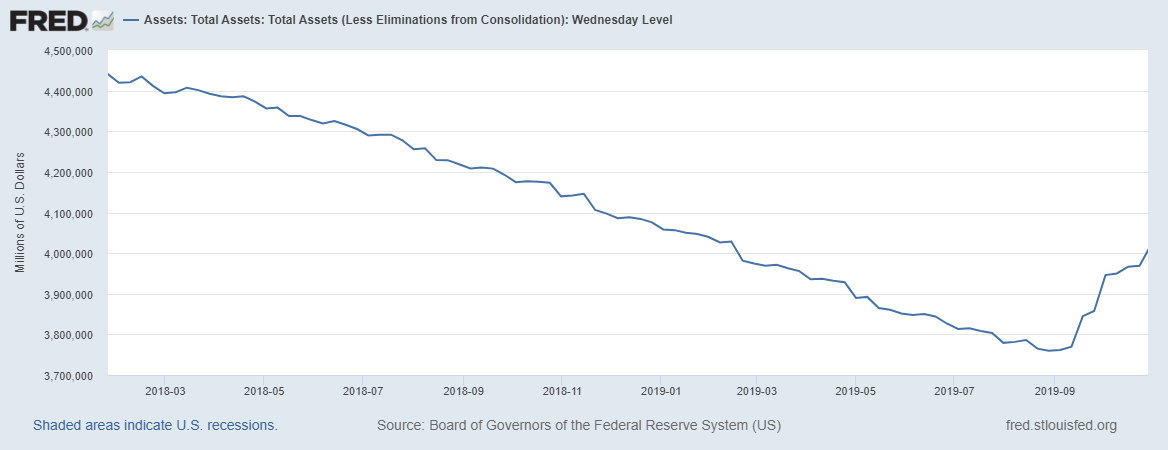
In our March 2022 Report, I wrote the following regarding the decision by the Western Powers to initiate sanctions against Russia’s central bank. “The implications are something that nobody really understands due to the complexity and interconnectedness of the financial system today.” Today, the implications are becoming clearer and combined with the Federal Reserve’s policy to engage in Quantitative Tightening (QT), (reversing of decades of Quantitative Easing QE/money printing), they are challenging at best. First, keep in mind, the effect of the Fed’s money printing operation was that it artificially fueled the stock market to record levels as shown below

We experienced a brief interruption in late 2018 when the Fed began to reverse course. Note the contraction in the Fed’s balance sheet… the result of QT.
And the stock market response was a quick 20% decline

Ans as shown above, the Fed quickly reversed course and the stock market rallied.
Fast-forward to today and in an effort to fight inflation, the Fed is once again engaging in QT with a similar result in the stock market as illustrated in the first chart above. Note how the black and blue line are declining in sync. The difference today is that we are witnessing potentially a new dynamic where reserves from a fiat banking system are being reduced as a result of QT at the same time that the US dollar risks being devalued further as the East threatens to tie their currencies to hard assets. It’s like bailing water out of a boat while new holes being poked in the bottom. The Fed is fighting inflation with QT while threats from the East are risking a further inflationary devaluing of the dollar. Is this a far-fetched threat? Think back to how Russia initially responded to Western sanctions. They required payment for their oil in rubles as opposed to the US dollar (the world’s reserve currency). More recently, there is speculation that Russia may link their oil to gold in response to the West’s $60 cap on their oil. If this were to occur, the US dollar would effectively get further revalued versus Russian oil. Keep in mind, Russia has the clout to follow through on this threat as they are the second-largest crude exporter globally, behind Saudi Arabia, according to Bloomberg. So… are we could be witnessing the birth of a new world (monetary) order centered around commodity-based currencies in the East that are strengthened by the tide of rising inflation that will further weaken the fiat, paper-based systems in the West?
Let’s summarize...
QT causes stocks to drop as risks an economic slowdown build,
As in 2018, the expectation is that the Fed reverses course and begins printing money to stimulate the economy and halt the drop in stocks,
As a result, increased dollars in circulation exacerbates the inflation problem, thereby further devaluing the dollar which in effect reduces banking reserves for lending, 4. At the same time, Russia ties oil to gold, thus reducing the purchasing power of the US dollar even further, taking inflation to new heights. In addition to Russia, while the US and other Western nations have engaged in the devaluing activities of money printing over the past 14 years, according to UN Comtrade Database, China has been stockpiling commodities and currently holds 80% of global copper inventories, 70% of corn, 51% of wheat, 46% of soybeans, 70% of crude oil, and over 20% of global aluminum inventories.
And now, according to this source, China is aggressively stockpiling every ounce of physical gold it can get its hands on.
It appears that the world may be experiencing major structural and secular changes that will outlast the current business cycle.
The Fed now faces a trilemma: how to reduce inflation, protect growth and jobs, and ensure financial stability. Can they possibly do all three?
In light of this uncertainty, what should an investor do?
My advice is to pay close attention to our capital flow indicators as summarized at the beginning of this report and described below, and as they change, so should the asset allocation of your portfolio.
In our seven asset classes listed, there are both inflation and deflation sensitive options. It is my belief that it would be prudent for investors to allocate a portion of their assets outside the traditional markets of stocks and bonds and into alternative asset classes. Some of these are included in our seven assets listed on page 1 of this report.
It is important to note that alternative investments can result in increased portfolio volatility and as with traditional investments like stocks and bonds, are not guaranteed and can decline in value.
Conclusion: Recognizing that we are in uncharted waters with multiple moving parts, we must admit that there is no way to tell in advance exactly how this will unfold. But in such a transitionary environment, the ability to properly anticipate change is predicated upon a detached analysis of information from multiple sources, applying that information to imagine a plausible world different from today’s, understanding how new data points fit (or don’t fit) into that world and adjusting accordingly.
Although this will be no easy feat, our answer at Consilience Asset Management is to employ a discipline that we believe has the ability to circumvent the effects of these uncertainties and disparities between the above noted risks and actual market action. Ultimately, it will be the forces of supply and demand that will drive prices of financial assets higher or lower, regardless of the fundamental, geopolitical, or economic circumstances.
The cornerstone of our process is our Global Macro Capital Flow Model. In this model, we monitor the movement of capital among the approximately $250 trillion of tradable global financial assets. Here, market trends can be identified regardless of their driver; debt, geopolitical, economic, or other… Below is a picture of the distribution of the world’s liquid investment assets as a percent of the $250 trillion total…

Source: BIS, Thompson Reuters, World Bank, World Gold Council, Financial Analysts Journal, (January 2019).
(The performance quoted herein represents past performance. Past performance does not guarantee future results)
By measuring the capital flows of each of these categories relative to the total, both favorable and unfavorable investment trends are identified.
At Consilience Asset Management, we employ this process in deploying client assets. A more complete description of our model and process can be found on our website: www.consilienceassetmanagement.com under the tab “Our Process.”
Based on this, the ratings for each of the eight asset classes that we monitor are included each month at the beginning of this report.
We are entering a new phase, as the decade-long bull markets for stocks appear to be winding down. We are cognizant of the new challenges inherent due to the structural changes noted in this report, as they will have a huge impact on the current supply/demand dynamics in the global marketplace.
As such, we realize that these are clearly challenging and unprecedented times and therefore it is important for the astute investor to be nimble and pay close attention!
Consilience Asset Management
Roger Faulring – Managing Partner/Portfolio Manager/Market Strategist Michelle Malone – President/Managing Partner Donna Stone – Partner/Investment Advisor
Roger Faulring is an Investment Adviser Representative (IAR) with and offers Investment Advisory Services through B. Riley Wealth Advisors, Inc., (BRWA) a SEC Registered Investment Adviser (RIA). BRWA and Consilience Asset Management are not affiliated.
All opinions and estimates included in this communication constitute the author’s judgment as of the date of this report and are subject to change without notice. The information provided is not directed at any investor or category of investors and is provided solely as general information about products and services or to otherwise provide general investment education. None of the information provided should be regarded as a suggestion to engage in or refrain from any investment-related course of action as neither B. Riley Wealth Management nor its affiliates are undertaking to provide you with investment advice or recommendations of any kind. Securities and variable insurance products offered through B. Riley Wealth management, Inc., Member FINRA/SIPC.
*Our Global Macro Tactical Strategy seeks to identify favorable investment opportunities among seven primary asset classes. Capital is rotated to the specific markets in an effort to control risk by underweighting or eliminating exposure to markets that exhibit elevated risk.
*Our Relative Capital Flow Model is the cornerstone of our tactical allocation decisions and is augmented by our Behavior, Economic, Monetary and Stability indicators.
IMPORTANT NOTICES: The information contained in this electronic message (including any attachments) is privileged and confidential information intended only for the use of the recipient(s). Please notify the sender by email if you are not the intended recipient. If you are not the intended recipient, you are hereby notified that any dissemination, distribution or copying of this communication is strictly prohibited. B. Riley Capital Management, Inc. ("BRCM") does not accept time sensitive, action-oriented messages or transaction orders, including orders to purchase or sell securities, via email or by any other electronic means. BRCM reserves the right to monitor and review the content of all messages sent to or from this email address. Messages sent to or from this email address are stored by a third-party vendor and may be provided to regulators upon request. Neither the sender nor BRCM accepts any liability for any errors or omissions arising as a result of transmission. Any information contained in this electronic message is not an offer or solicitation to buy or sell any security, and while such information has been obtained from sources believed to be reliable, its accuracy is not guaranteed. Any references to the terms of executed transactions should be treated as preliminary only and subject to BRCM's formal written confirmation. This message is for information purposes only and is not an investment recommendation or a solicitation. Past performance is not indicative of future returns. All information is subject to change without notice. Unless indicated, these views are the author's and may differ from those of the firm or others in the firm. BRCM does not represent this is accurate or complete and may not update this information.